Among the many reasons students seek a postsecondary education, the promise of economic mobility is front and center. In fact, the majority say higher earning potential is a primary reason they enrolled. We designed the Student Access and Earnings Classification to study whether institutions are making good on this fundamental promise.
To be clear, we believe that earnings cannot and should not be perceived as the sole indicator of institutional success – but we also believe it is a measure that should not be ignored. In our approach, we wanted to provide more context and nuance into how we analyze earnings, and we wanted to do something different than others are offering.
This blog is the second in a two-part series that explores both dimensions of the Student Access and Earnings Classification. You can read the blog on access here.
Why do we measure earnings?
In 2022, when the Carnegie Foundation and the American Council on Education first partnered on updates to the Carnegie Classifications, our initial premise was to measure social and economic mobility. We wanted to understand which institutions were helping students who had historically been underserved or who were from lower-income backgrounds and propelling them into higher earning careers, and we wanted to organize (i.e., classify) the sector accordingly to pull out trends and identify positive outliers.
The classification we ultimately created, the Student Access and Earnings Classification, doesn’t measure the value of the degree or colleges’ return on investment. Instead, it offers a perspective on whether institutions are ensuring their students are competitive in their respective job markets based on their local economies and demographics. This gives us insight into where schools are succeeding or falling short, while also giving a new tool to compare, collaborate, and improve.
Which students are included in the earnings measurement?
The Student Access and Earnings Classification uses data provided by the U.S. Department of Education’s College Scorecard, specifically the salaries of former Title IV undergraduate students (meaning undergrads who received a federal student loan loan, a Pell Grant, and/or were on work study) eight years after they enrolled. We compare their data to the earnings of 22 to 40-year-olds in their area with the same demographic profile who hold at least a high school diploma.
We use this earnings data because federal aid records provide the most comprehensive and consistent data source that exists. In addition, Title IV students are of particular interest because they are supported by public dollars and generally have more financial need than non-Title IV students – so they would particularly benefit from the economic mobility that could come with a college degree.
This specific earnings figure also includes a fuller picture of the student experience, including those who didn’t complete a degree and those who transferred. Including these students ensures institutions are not accountable for their completers only, and it gives schools like community colleges credit for the ultimate outcome a student achieves. It also allows us to capture the potential economic mobility of other learning experiences, like earning a non-degree credential or having a work-based learning opportunity that led to a job, even if a student did not complete a degree. Because this figure captures what students were earning eight years after enrollment, students have had some time make progress on their education pathway and enter the workforce, but we can capture both students who took four years to complete as well as those who took seven.
While the earnings data includes those who had W2 or 1099 self-employment earnings, those who are working in the gig economy and/or earning income through other channels (e.g., Zelle/Venmo or cryptocurrency) may be either excluded or potentially have their earnings undercounted. For former students who are still enrolled in college (including graduate school), who are not working, or who are not working in the organized workforce (such as a full-time parent), they are omitted from the data and do not count against the school.
How do we ensure fairness in our methodology?
We take several steps to make the methodology as fair and comparable as possible.
First, we use median earnings, not the mean, so results are not distorted by a small number of unusually high earners. For example, if most graduates from one school become nurses and one becomes a billionaire entrepreneur, the mean would give a misleading picture of typical outcomes.
We also compare institutions to similar types of colleges and universities (Institutional Classification) in our default approach. Schools with distinct academic missions are grouped accordingly, so an engineering school is not evaluated against an art school.
To provide a more contextualized view of outcomes, we account for ways race, ethnicity, and geography shape earnings. Someone working in a small town in South Dakota will likely earn less than someone working in midtown Manhattan, and our methodology reflects those differences by customizing the comparison value for each institution based on their student profile and setting expectations accordingly.
But we also know no methodology can capture every factor that shapes earnings. Instead, this serves as a baseline for understanding how a typical student is faring compared to their peers in their area, and we invite users to think of it as a starting point for that analysis.
How are institutions classified based on their earnings score?
The earnings measure places institutions into low, medium, and higher earnings categories based on how their former students’ earnings compare to the local labor market.
The benchmark is whether the median former student out-earns 22 to 40-year-olds in their area who have at least a high school diploma. That places them into Medium Earnings. Institutions earn a Higher Earnings designation when former students’ earnings are at least 25% (2-year schools) or 50% (4-year schools) above that benchmark.
Simply put, if students can outperform their local labor market, that signals the institutions they attend are setting them up for financial success.
What have we learned from the Student Access and Earnings Classification so far?
Big picture, the earnings measurement shows that the vast majority of higher education institutions across the country are providing reliable economic pathways for their students. At 90% of four-year institutions and at two-thirds of associate colleges, students’ earnings eight years after enrollment are at least equal to those of their peers in their area if not substantially higher.
Overall, we think the Student Access and Earnings Classification prompts interesting questions. How well are students transitioning into the workforce? Are institutions offering high-quality programs aligned with employer needs? Are students gaining access to paid work-based learning, completing their degrees, and getting the guidance they need to pursue paths to economic mobility? How do other measures like cost or completion intersect with our data?
We also know there are places in the data where the methodology may not tell the whole story. For example, institutions located in larger, urban areas typically have former students competing against a highly educated population, where there’s a higher cost of living. This prompts questions about the best way to capture mobility for students in those areas. In rural communities, by contrast, the value of a college degree is especially visible. For example, our data shows that community colleges in rural areas often are classified as Medium or Higher Earnings, suggesting their students are going onto earn wages above and beyond what their peers are able to do and inviting questions about partnerships with local employers and high schools that may be leading to those results.
We have also seen that institution-level earnings don’t always reflect the differences across academic programs. A college’s overall earnings measure may look very different when broken down by field of study. That’s why earnings data is most useful when institutions use it to ask questions, identify patterns, and learn from one another.
As institutions, policymakers, and researchers work to ensure higher education remains a powerful engine for economic mobility, these early insights tell us we have colleges and universities that are already excelling in this area. There also are pockets of the sector – some known and some less discussed – where it seems like certain credential types or certain majors may not have as much of an economic pay-off. But there are also places where we see institutions bucking the trend or outpacing their peers and equipping their students for the reality of today’s labor market. That is really encouraging.
We plan to release the next update of the Student Access and Earnings Classification in 2028 and will continue to refine the methodology to factor in more nuance and geographical considerations as we are able. We’ll share more about those updates as we get closer to release.
When the Carnegie Classifications introduced the Student Access and Earnings Classification, we set out to more fully explore what plenty of research has already shown: higher education is a reliable engine of social and economic mobility for students nationwide.
A few frameworks currently exist to measure the value of higher education and its return on investment; however, the Student Access and Earnings Classification is unique among similar tools in the field. Initially created to measure social and economic mobility, this classification aims to assess the extent to which institutions act as springboards to better lives for their students.
To investigate this central theme, our methodology considers two separate dimensions: whether institutions enroll students who reflect the communities they serve—what we consider access—and whether those students go on to earn competitive wages compared to peers in their area—also known as earnings.
This blog, the first in a two-part series that explores both dimensions, takes a closer look at access—why we measure it, how we measure it, and what we’ve learned about so far.
Let’s start with why and how we measure access.
The higher education experience starts with a letter of acceptance. Before students can reap the benefits of a college education, they first need to get in.
But for low-income students and those from racially diverse backgrounds, college access can be uneven. Oftentimes, the people for whom a higher education would be most beneficial are the same people who are excluded from the experience.
With that in mind, we do not consider selectivity the same as access—an institution could accept 100% of the students that apply, but if those students only represent part of the larger community, we do not consider that highly accessible.
Our specific goal is to understand whether the student population at a specific institution reflects the demographics of the places that institution serves, focusing on identifying colleges that are granting access to students who often face barriers to entry and are underrepresented in U.S. higher education. That is an essential part of the classification, and it aims to help us better understand institutions’ role in expanding opportunity for students instead of preserving it for those already likely to attain a college degree.
There is no perfect way to measure access. There is, however, enough publicly available, universal information that allows us to explore how well institutions are providing access to students from low-income and racially diverse backgrounds.
To that end, we use two data sources to measure access:
- Undergraduate students who receive Pell Grants, and
- Undergraduate students from underrepresented racial/ethnic groups.
We contextualize that data for each school based on the demographics of the population for the areas each institution serves. Depending on the location its students are coming from, the institution may have a higher or lower percentage of students who are expected to come from those groups. This helps us to more accurately measure whether the students that an institution enrolls fully reflect the places it serves.
How can measuring access drive student success?
By measuring access, we are providing the field with a benchmarking tool that can help researchers, policymakers, and institutional leaders examine how campuses are serving students and their community, where patterns diverge across different institutions, and what those differences may reveal about policy, practice, and incentives across the field.
Over time, we hope the insights uncovered by the Student Access and Earnings Classification will help institutions make decisions that focus on expanding access and delivering stronger outcomes for students.
What have we learned so far?
The vast majority of colleges that primarily award associate degrees (91%) and about three-quarters of colleges that offer a bachelor’s degree or above (76%) are providing higher than expected access to students from lower-income and underrepresented racial populations. You can use our visualization tool to learn more about these institutions and the level of access institutions are offering.
Additionally, 478 schools have been named Opportunity Colleges and Universities (OCUs), a designation that pushes back on a long-standing assumption: that serving more lower-income students and more racially diverse students will result in lower outcomes. Our analysis shows otherwise. OCUs are distinguishing themselves by both providing high access and showing strong earnings outcomes for students, offering concrete examples of how colleges and universities can expand opportunity without compromising student success.
We also see differences in access across peer groups (Institutional Classifications) as well as places where access may be similar but earnings outcomes are different. Those are places we want to study further.
The Student Access and Earnings Classification is about measuring what matters: whether students are benefitting from the promise of higher education, especially those who have the most to gain from going to college.
Access is an essential dimension of this framework—it is the foundation of opportunity and a gateway to long-term success. We’ll unpack the second dimension—earnings—in our next post.
Over the past several years, as many as 25 states have used the Carnegie Classifications in some form of policy or practice, including funding formulas. The 2025 Carnegie Classifications provide states with a modernized, comprehensive framework to support higher education policy and funding decisions through three distinct components: the Institutional Classification, Research Activity Designations, and the Student Access and Earnings Classification (SAEC).
To help navigate the updates, two briefs published by HCM Strategists provide state leaders with ideas on how to use the 2025 Carnegie Classifications to improve higher education policy and student outcomes. Beyond Labels: How States Can Use the 2025 Carnegie Classification to Understand and Advance Student Success, which focuses on the SAEC, and Carnegie Classifications Redefined: A Framework for Smarter State Policy and Better Outcomes, which discusses the Institutional Classification, highlight how the reimagined classifications provide state agencies and systems, legislators, and advocates with a tool to drive toward their collective goals.
As the briefs outline, the updated Classifications can be used in a number of ways and intend to prompt questions that can guide strategic planning and analysis. For example, states can leverage the Institutional Classification to establish quality peer groups for meaningful benchmarking, allowing them to compare similar institutions on common performance outcomes, understand how institutions utilize resources and respond to policies, and identify best practices worth scaling. States can expand eligibility for research and economic development programs beyond traditional R1 and R2 institutions, recognizing the contributions of a broader variety of institutions including the newly designated Research Colleges and Universities (RCUs).
Additionally, the SAEC offers states a third-party tool to assess how institutions are serving students from their communities and helping them achieve strong economic outcomes, with earnings measures that account for regional economic factors. This approach equips states with data that can further their goals for economic mobility and student success. They can use the classifications to support learning among peer campuses, disseminating practices from institutions with strong SAEC metrics and developing improvement agendas for underperforming institutions. Legislators can promote the SAEC as a lens for public accountability, asking how current policies reinforce economic mobility and ensuring students from economically challenged communities have access to high-performing institutions. By leveraging these classifications, states can further their work to deliver a more transparent, outcomes-focused higher education ecosystem that rebuilds public trust and delivers measurable value to students and communities.
For more, please read the briefs:
Brief 1: Beyond Labels: How States Can Use the 2025 Carnegie Classification to Understand and Advance Student Success | Student Access and Earnings Classification
Brief 2: Carnegie Classifications Redefined: A Framework for Smarter State Policy and Better Outcomes | Institutional Classification
The Carnegie Classifications were created over half a century ago with a clear purpose: offering researchers a more nuanced understanding of the nation’s higher education landscape.
Since then, the classifications have evolved to have an outsized influence on institutional benchmarks, organization, and resources, largely shaped by the chase for an R1 designation and a high U.S. News & World Report ranking. When ACE took on the work of stewarding the classifications in 2022, the transition created a moment to reset and ensure the Carnegie Classifications were serving their fundamental purpose of organizing and categorizing the U.S. higher education sector. We also wanted to focus on how institutions were serving students through the lens of a classification system.
When we set out to redesign the Carnegie Classifications, we had some clear goals: to right-size how they influence policy and practice, center students in the methodology, and provide a more meaningful, multidimensional framework that both reflects higher education in the 21st century and pushes the field to focus on what matters most.
What We’ve Heard
Over the course of the last three and a half years, we connected with more than 10,000 stakeholders to hear from them about what works, what didn’t work, and what they want the Carnegie Classifications to be.
Across these conversations, several themes consistently emerged: a desire for more nuanced ways to understand the sector, greater clarity on how the classifications were developed, and better insight into the factors that determine an institution’s classification.
We heard that the focus on research was overemphasized, driving an outsized amount of time and money to be spent on the “chase for R1,” while also being opaque and informing rankings systems that have little to do with the intent of the classification. At the same time, we heard that a wide variety of research happening beyond the R1 and R2 categories was not recognized.
Our conversations around the design of a new classification system that would be focused on students’ social and economic mobility – which ultimately resulted in the Student Access and Earnings Classification – felt relevant to leaders and experts throughout the sector. They shared frustrations with ranking systems and how components like geography or different program types were not taken into account in existing models.
These insights informed key decisions in the Carnegie Classification’s redesign.
The 31 groupings in the 2025 Institutional Classification were developed to provide more nuance, multidimensionality, and transparency, better capturing the variety of institutional types and organizational structures that exist today. This classification now organizes institutions by multiple characteristics, including their size, the types of degrees they award, and the fields of study in which students receive their degrees.
The update addresses many of the limitations of the historic Basic Classification, which organized most institutions primarily by academic program concentration or the highest degree awarded and fell short of describing a fuller scope of activity on campus.
Additionally, the research designations are now independent from the Institutional Classification, the methodology for determining R1 now uses a clear threshold, and a new designation, Research Colleges and Universities, recognizes research happening at colleges and universities that offer few or no research doctorates.
We also introduced the Student Access and Earnings Classification, providing a classification-based lens for how to consider how well institutions are serving students compared to similar types of institutions.
While no classification system can perfectly capture the complexity of the higher education landscape, the feedback we have received has been invaluable in shaping how we offer a more informative, accurate, and useful system for understanding the field.
As expected, these updates come with a learning curve, particularly the new Institutional Classification. People naturally seek simple ways to understand and categorize complexity — winners and losers, best and worst, high and low. The redesigned Institutional Classification instead presents a spectrum that aims to capture the wide variety of institutions that exist today. Some institutions have struggled to understand where they fit into the new framework or have asked us about choices we made in the methodologies. Here are a few of the questions that we tend to hear most.
“What drives the Institutional Classification?”
The Institutional Classification aims to capture more of the typical or median student experience as opposed to the prior methodology’s focus on the highest degree awarded. So, while an institution might grant many different types of degrees, the Award Level Focus generally describes where an institution awards the most and/or has a sufficient emphasis.
Additionally, although an institution may offer a range of programs, for most colleges, the Academic Program Mix reflects the fields of study in which at least 50% of its undergraduate students major. Generally, institutions are classified as Special Focus if they award at least 50% of degrees in a single academic area, concentrated field of study, or set of related fields. These institutions may award degrees in other subject areas, and special focus should not be interpreted as the institution’s only academic program – but it is the field of study that at least 50% of its students pursue for their degree.
In considering these dimensions, along with size, institutions are classified alongside those that award the same types of degrees, in the same fields of study, and generally operate at the same scale.
“Is it fair to compare a school that produces all the teachers in the community to an institution that does not? Doesn’t your focus on earnings hurt institutions that prepare students for socially beneficial but lower paid professions?”
By using earnings to measure outcomes, we’re holding institutions accountable for delivering on one of the fundamental promises of higher education. At the same time, we recognize that earnings potential differs between career fields and job markets.
Here are a few ways our methodology aims to account for those differences:
- Schools with similar programs of study are classified together. For example, art schools are grouped with other art schools, and schools that focus primarily on engineering and technology are grouped with other schools that focus primarily on engineering and technology. That means earnings data is more comparable and reflects the outcomes of those who attend similarly focused programs. In other words, the earnings data for a visual artist who attended a design school isn’t competing with a biomedical engineer who attended a STEM-focused institution.
- By using the median average of earnings — and not the mean — the data isn’t influenced by outliers. The income of a multimillionaire doesn’t skew the data upward in the same way the income of a substitute teacher doesn’t skew the data downward. We’re looking at the middle ground and focusing on the realistic earnings of a typical former student – the 50th percentile. For many institutions, this would likely be the earnings of a student who majored in one of their largest programs. At the average institution with an education program, around 5% of students majored in teacher education.
- We also accounted for the ways race, ethnicity, and geography intersect with earnings data to offer more nuanced insight into how students performed as compared to their peers, recognizing that labor markets are different in different pockets of the country.
- We are using an earnings measure that is eight years out from entry. Most students have had some time to enter the workforce, and while they would still be in the early stages of their career, if they are working in a full-time job, they are likely contributing positively to their institution’s median earnings value. For many socially beneficial professions, like teaching and social work, demand to fill those roles is high.
“Why do you count all students for the Student Access and Earnings Classification, not just those who completed?”
We know some measures evaluate colleges and universities based only on the data for students who have completed. Our approach aims to understand, in part, how the experience at an institution equipped all students to advance their social and economic mobility.
For many students, completing their degree provides a credential that is rewarded in the labor market. Other students may complete a credential — which is not often counted as completion — such as a certificate program or other coursework that provides them with an opportunity to advance their career. We wanted to capture all of those experiences to the fullest extent the data allows.
We also did not want to classify institutions based on only a small portion of their student body, which would be the case for some institutions that have low completion rates. We see potential in studying how many other data points, including retention and completion rates, cost and debt loads, workplace learning opportunities, as well as job placement, intersect with the Student Access and Earnings Classification.
“Why didn’t you include cost in the Student Access and Earnings Classification?”
Cost or price is another measure that others may choose to incorporate in their measures of value or return on investment, which is a reasonable approach. Our classification system aims to identify which institutions, in the context of their peer groups, are providing higher levels of access and higher-than-expected earnings outcomes for students. On an institution’s dashboard, we report data related to average net price, as this can be helpful context to consider, but it is not what the Student Access and Earnings Classification measures.
“What data are you going to use going forward? Are you going to be able to do this again?”
We know there are questions about what data the federal government will collect and publish moving forward. We will make determinations about what data we will use for the 2028 Carnegie Classifications as we better understand the data landscape in the coming years.
What’s Next?
We are already exploring ways we can continue to refine the classifications as we look toward the next release in 2028. Some of the most consistent areas of feedback have centered around how geography and regionality factor into the methodology, where associate colleges fit, and how we will measure elements like research activity.
In states where conversations are happening about the value of higher education, we hope the Student Access and Earnings Classification will be used as a tool to inform those discussions and help set meaningful benchmarks. We have also been encouraged to hear that institutions often find the other campuses within their Institutional Classification to be more natural peers, which we hope will equip institutions, researchers, accreditors, and others to foster more benchmarking and collaboration to drive toward shared goals.
We overhauled the Carnegie Classifications to make them more useful, relevant, and reflective of the nation’s ever-evolving higher education landscape. But this redesign is not a one-and-done deal. This is just the beginning of an ongoing effort to better equip the field to center student success and focus on the true value of higher education and how it intersects with important conversations like cost, access, and outcomes.
We believe the redesigned Carnegie Classifications can serve as a tool for building a better, more student-centered higher education sector, and we are committed to transparency, accountability, and partnership as we work on updates.
Thank you for your feedback so far, and feel free to share more at [email protected].
The newly redesigned Carnegie Classifications are intended to better reflect the multifaceted nature of the higher education landscape and to measure the extent to which institutions provide students access and a path to earning competitive wages. The 2025 update includes a revision of the historic Basic Classification, now titled the Institutional Classification, and a newly developed Student Access and Earnings Classification.
Learn more about the 2025 Student Access and Earnings Classification here.
Additionally, the Carnegie Classifications now identify institutions within the Student Access and Earnings Classification that can serve as models for studying how campuses can foster student success, designating 478 of them as Opportunity Colleges and Universities. These 478 schools represent a wide variety of institutions of all sizes, locations, and types as drivers of opportunities for students. Here’s how a few of them are reacting to their new recognition:
- Germanna Community College (Fredericksburg, VA): “This is extremely gratifying news for Germanna and the communities it serves. Being nationally recognized as an Opportunity College reflects the College’s commitment to serving all students and the transformative impact we are having on the economic prosperity of our students and region. It reinforces the idea that community colleges like Germanna are the engines of economic mobility and community growth.” – Dr. Janet Gullickson, President of Germanna Community College
- Morehouse College (Atlanta, GA): “Morehouse College has been a school dedicated to providing knowledge, skills, and experience to students of all economic backgrounds. From our inception, we have focused on uplifting students to become leaders who serve their communities. We are proud to be recognized for our commitment and enabling our students to pursue rewarding professional lives after graduation.” – Dr. Kendrick Brown, Provost and Senior Vice President of Academic Affairs, Morehouse College
- St. Thomas University (Miami Gardens, FL): “St. Thomas University’s newest Carnegie Classification underscores two of our core values: expanding access to higher education and equipping graduates for high-earning careers. According to the Florida Department of Education, recent STU undergraduate alumni earn an average annual salary of more than $73,000. This is the highest among Florida’s Independent Colleges and Universities, and above the average for graduates of the State University System.” – David A. Armstrong, J.D., President of St. Thomas University
- Arkansas Tech University (Russellville, AR): “Achieving Carnegie Opportunity University status is representative of our mission at Arkansas Tech. Students come to ATU seeking a better life through higher education, and we deliver that with high-quality and relevant programs, dedicated faculty and staff and a commitment to providing a learning environment that develops the whole student.” – Dr. Russell Jones, President of Arkansas Tech University
- Cal State San Marcos (San Marcos, CA) “At Cal State San Marcos, social mobility isn’t just a goal—it’s our mission in action. To be named an Opportunity College and University by the Carnegie Classifications is a powerful affirmation of the work we do every day to ensure that our students, many of whom are the first in their families to attend college, graduate with the tools, support and opportunities to thrive in their careers and communities.” – Ellen Neufeldt, President of Cal State San Marcos
- Nova Southeastern University (Ft. Lauderdale, FL) “Our mission is rooted in expanding access, driving innovation, and preparing our students for purposeful careers, particularly through the pursuit of professional and terminal degrees. This recognition is a powerful affirmation of our commitment to our students, and we are proud to be a national leader in both student access and student career success.” – Harry Moon, M.D., President and CEO of Nova Southeastern University
- Design Institute of San Diego (San Diego, CA) “It is a great honor to be included among the 479 institutions that serve as models for studying how campuses can foster student success. We are pleased that the Carnegie Foundation and ACE have worked together to identify and recognize institutions that not only strive but also succeed in supporting student success. Design Institute staff and faculty have always provided individualized student support, and this recognition confirms the results of that commitment.” – Margot Doucette, President of the Design Institute of San Diego
- Albion College (Albion, MI): “At Albion College, our mission has always been to open doors of opportunity and equip our students to not only navigate the world but to shape it. Being recognized as both an Opportunity College and a Higher Earnings institution affirms the value of an Albion education and the life-changing impact of our commitment to experiential learning and personalized student mentorship and support. We’re proud to provide every Briton—regardless of background—with the tools to excel academically, graduate with confidence, and embark on meaningful, purpose-driven careers.” – Wayne Webster, President of Albion College
- Ball State University (Muncie, IN) “We are grateful to be recognized by the Carnegie Foundation for the Advancement of Teaching and the American Council on Education. This designation is a meaningful affirmation of our commitment to student success and the real-world impact of a Ball State education. It also reinforces our mission of empowering our graduates to have fulfilling careers and meaningful lives enriched by lifelong learning and service.” – Dr. Anand R. Marri, Provost and Executive Vice President for Academic Affairs, Ball State University
- Western Illinois University (Macomb, IL) “Social mobility has long been a part of our DNA at Western. Our University vision is to be the leader in educational quality, opportunity and affordability. Our recognition by the Carnegie Foundation is a reflection of our commitment to our vision” – Kristi Mindrup, President of Western Illinois University
- Stony Brook University (Stony Brook, NY) “Stony Brook is one of the nation’s leading research universities, with a growing and highly diverse student body that includes many who are the first in their families to attend college. This Carnegie Classifications recognition is a testament to Stony Brook’s commitment to providing an exceptional education that is accessible to students from all backgrounds. Our students graduate and we are among the top universities in propelling their affluence and opportunity.” – Richard L. McCormick, Interim President of Stony Brook University
- Ferris State University (Big Rapids, MI) “We are one of very few institutions in this country that a third party has come in the door and said, ‘Well done. Your institution is preparing students to go into well-paying jobs and career paths. We talk about how we build champions here, in sports, and in the classroom. This recognition validates that point. Our graduates take the quality education Ferris State provides and do amazing things in our state.” – Dr. Bill Pink, President of Ferris State University
- Western Governors University (Salt Lake City, UT) “The new Carnegie Classification affirms WGU’s work to expand the role of higher education as a driver of economic mobility and personal growth. At a time when students and employers alike are demanding greater relevance and value, WGU is delivering. Our competency-based, tech-enabled model empowers students to gain in-demand skills, earn credentials, and advance their careers—without putting their lives on hold or leaving their communities. This recognition reinforces what we strive for every day: transforming lives at scale, strengthening communities, and powering the workforce of tomorrow.” – Scott Pulsipher, President of Western Governors University
- New Mexico Military Institute (Roswell, NM): “As a designated Opportunity College and University, NMMI proudly embraces its mission to expand access and foster upward mobility for students from all backgrounds. This recognition aligns directly with our commitment to preparing cadets—many of whom are first-generation college students—for success in higher education and beyond through structured support, academic rigor, and leadership training.” – Col. Orlando Griego, PhD, Chief Academic Officer/Dean of Academics at the New Mexico Military Institute
- Mercy College of Health Sciences (Des Moines, IA) “We are honored to be recognized as an Opportunity College. Many of our students are Pell-eligible and come from historically underrepresented communities. Guided by our Catholic heritage and the values of the Sisters of Mercy, Mercy College prepares graduates through a rigorous health sciences education designed to meet the evolving needs of the healthcare workforce.” – Dr. Adreain Henry, OD, EdD, MBA, President of Mercy College of Health Sciences
- Otis College of Art and Design (Los Angeles, CA): “We are proud to be one of a select few art and design colleges in the U.S. to be an Opportunity College for Higher Earnings and Access. Carnegie’s findings illustrate Otis College’s commitment to student success even after graduation. At Otis, preparing students to thrive in creative careers is core to who we are. And we succeed, as 96% of our recent graduates are employed within a year of receiving their degree. We look forward to supporting future creatives and helping them achieve upward mobility.” – Charles Hirschhorn, president of Otis College
As part of our ongoing commitment to transparency and accuracy, the Carnegie Classifications invites institutions to submit appeals, report anomalies, request special consideration, or raise other relevant issues regarding their data, Institutional Classification, or Student Access and Earnings Classification. Appeals can be submitted online through the end of June.
Institutional preferences for how they are classified are not sufficient grounds for an update. There must be data-based evidence to warrant a successful appeal, and the Carnegie Classifications staff must be able to use existing data sources (i.e., IPEDS, College Scorecard, or the Census Bureau) to locate replacement data.
Here are a few examples of the kinds of considerations we may encounter:
- An institution may have a degree mix that sits just at or slightly above or below a classification threshold.
- An institution may have degree reporting patterns that do not fully reflect how the institution sees itself or how it practically functions.
- An institution may experience an anomalous reporting year, resulting in outlier data not representative of its typical profile.
We will consider each request on its own merits while also maintaining the integrity of the Carnegie Classifications methodology. We value feedback from institutions and appreciate your engagement in helping us ensure the classification is transparent, accurate, and fair.
Institutions are asked to coordinate their review and submit one appeal per institution. Please use this form to submit your consideration or request by June 30, 2025.
With public confidence in colleges at a crossroads, Ted Mitchell and Timothy Knowles call for a new social contract centered on student success—and offer the Carnegie-ACE classification as a path forward.
Since the Carnegie Classifications were first introduced in 1973, the world – and higher education – has changed tremendously. But the classifications have not. As a result, the Carnegie Classifications largely has used a 50-year-old perspective to organize U.S. colleges and universities as they operate today, and given how the classifications are used by policymakers and others, that has resulted in focusing on institutional behavior that may not always center on what is best for students.
This year, to better reflect the breadth of the United States’ higher education system in the 21st century, we’re unveiling a series of significant updates to the Carnegie Classifications. This release follows a period of learning and collaboration with the field, and we wrote about our learning and reflections in the January/February 2025 edition of Change Magazine, sharing more about why the Carnegie Classifications are important and how they continue to shape higher education. The article goes into the history of the Carnegie Classifications and their significance throughout the past half century, focusing in particular on what has happened following the 2005 update that was previewed by our predecessors in the January/February 2005 edition of Change. We also explain why now is the time to lean into the ever-changing higher education landscape and adapt our work to reflect that. Here’s a quick excerpt:
In all of our conversations over the past couple of years, we actually have wondered whether the Carnegie Classifications should be discontinued entirely. But there’s a reason the classifications are used so often and so widely: They are familiar, comprehensive and extremely useful. …
Ceding the ground to a host of third parties—some of which might have their own motivations for creating a classification system—could easily lead us to a worse, less accurate state. Instead, we are keeping them—with revisions and updates.The reimagined framework of the classifications will better reflect the increased diversity of institutions and the learners they serve, with more data and more tools for institutions and researchers to use. It will also be a classification system that can grow with the sector over the years to come. The classification system will never be perfect. Undoubtedly, in future releases, we will improve the methodologies further, add more and better data, and adjust what is not working. Classifying such a diverse mix of institutions means establishing clear lines between groups, and there will always be institutions that are borderline cases, as well as institutions that do not agree with where the lines were drawn. But we hope by revisiting the purpose of this classification system and reflecting on the work underway across the sector, we will create a system that recognizes and captures the diversity and breadth of institutions—so we can all learn what is working best for students.
For years, the Carnegie Classifications research designations were only open to a narrow set of doctoral-granting institutions. Many colleges and universities across the country were engaging in meaningful research, however, their contributions were not being recognized.
As part of our work to redesign the Carnegie Classifications, last month we introduced a Research College and University (RCU) designation to identify research happening at colleges and universities that historically have not been included in the research activity index, including institutions that do not offer many or any doctoral degrees.
Learn more about the Research Activity Designations here.
216 institutions with wide-ranging missions were given the RCU distinction this year. Here’s what a few of them are saying about their new designation:
United States Air Force Academy (Colorado Springs, CO)
“We pride ourselves at the U.S. Air Force Academy on offering cadets opportunities to engage in research that directly supports the warfighter and our national security. Carnegie’s new designation highlights what we have known for a long time – that the Academy develops the critical thinkers ready to lead in the U.S. Air Force and U.S. Space Force.”
— Brig. Gen. Linell Letendre, Dean of the Faculty at USAFA
Bowie State University (Bowie, MD)
“This achievement is a transformative step forward for Bowie State University to reach our goal as an R2 designated institution. With this designation, the university is poised to attract new funding opportunities, enhance cutting-edge faculty research and inspire the next generation of scholars and changemakers.”
— Dr. Aminta Breaux, President of Bowie State
Rhode Island School of Design (Providence, RI)
“We are honored to receive the new Research Colleges and Universities designation by Carnegie Classifications and the American Council on Education. As one of the few art and design institutions to receive this distinction, RISD affirms the vital importance of scholarship to art and design education and creative practices. Artists and designers are uniquely positioned to create and enact solutions that address critical societal issues. Our research initiatives, driven by outstanding faculty, provide opportunities for collaboration, learning and experimentation, which sustain RISD’s culture of inquiry and critique and underscore the comprehensiveness of a RISD education.”
— Crystal Williams, President of RISD
Bowdoin College (Brunswick, ME)
“It is truly a testament to the success of our faculty in securing external research support and to the growth of our student research program at Bowdoin.”
— Jennifer Scanlon, Dean for Academic Affairs at Bowdoin College
Roseman University of Health Sciences (Henderson, NV)
“This recognition validates Roseman University’s commitment to advancing healthcare through innovative research and academic excellence. Our graduate-level education programs – master’s degrees in biomedical sciences and pharmaceutical sciences – along with our research programs are creating new knowledge and discoveries that contribute to Nevada’s growing biomedical ecosystem.”
— Jeffery Talbot, PhD, Vice President of Research and Dean of the College of Graduate Studies at Roseman University
Marymount University (Arlington, VA)
“We set a strategic goal in 2019 to become a research-intensive institution, and our new Research University designation is a direct result of our efforts. It is a testament to the dedication of our faculty, students and research leaders whose innovative and applied research is making a tangible impact in our communities. It is also an important step towards attaining R2 status, and we remain steadfast in our commitment to advancing knowledge that serves society.”
— Dr. Irma Becerra, President of Marymount University
John Jay College of Criminal Justice (New York, NY)
“The inclusion of John Jay College in this new Carnegie classification affirms what we have long known. Our faculty are leading experts in their fields and our institution is at the forefront of critical research that informs policy and practice.”
— Karol V. Mason, president of John Jay College of Criminal Justice
Bryn Mawr College (Bryn Mawr, PA)
“Bryn Mawr has long been a place where rigorous inquiry and deep intellectual engagement thrive. This new designation affirms what we have always known—our faculty and students are making meaningful contributions to the world through research that advances knowledge and shapes the future.”
— Wendy Cadge, Bryn Mawr College President
Cal Poly Humboldt (Arcata, CA)
“This designation reflects Cal Poly Humboldt’s deep commitment to fostering a research-driven educational experience for our students and faculty. It acknowledges the incredible work happening across all disciplines and reinforces our role as a hub for innovation, hands-on learning, and meaningful research and creative projects that impacts our North Coast community and beyond.”
— Kacie Flynn, Associate Vice President for Research at Humboldt
Life-saving research. World-shaping cultural exchange. A shared sense of civic participation. Creating pathways for adults to gain new skills. Equipping local employers with a ready workforce. The contributions colleges and universities make to American life are as varied as the institutions themselves. But from the smallest community college to the largest public university, one shared mission stands above the rest: particularly in the 21st century, going to college should be a springboard to a better life.
Success in that role depends primarily on two questions: Are we opening our doors to a wide range of students? And are those students leaving college with an education that puts them closer to the future they have dreamed of and worked for?
Whether colleges and universities can truthfully answer both of those questions in the affirmative should be among the most important metrics of a school’s impact. And yet, in our current system, institutions of higher education are often measured on and rewarded for metrics that have little to do with students and more to do with the institutions themselves.
Since its creation 50 years ago, the Carnegie Classifications system has become one of the most relied-upon lenses through which colleges view themselves and each other. Originally intended to support research and policy analysis, it has evolved to have a significant influence on higher education. For example, some funding agencies use it to make decisions about where to allocate resources, and through its use in the U.S. News and World Report’s “best colleges” rankings, the classifications have an enormous if indirect sway in how prospective students make quick decisions about which colleges are better than others. These unintended uses have had an undue impact on institutional behavior, and we want to reroute that influence to more squarely benefit learners.
With a better understanding of how these classifications are used, the American Council on Education and the Carnegie Foundation for the Advancement of Teaching have been exploring how we can strengthen the classification system by incorporating a measure that examines how schools are serving students.
In next year’s release, as a complement to our revised Basic Classification structure, we are introducing a Social and Economic Mobility Classification. This new classification will identify schools that provide strong socio-economic mobility for students and offer insight into how a school compares to similar campuses. The new classification is intended to center students and drive institutional improvement that can increase access to higher education and improve outcomes.
To develop this new way of classifying schools, the methodology has to accomplish a couple of things. The first is to create groupings of similar institutions, likely connected to the Basic Classification, that would account for differences in areas like institutional missions, types of degrees granted, academic programs, instructional modalities, and availability of resources. By grouping similar schools, we aim to avoid the flawed conception of vastly different colleges being simply “better” or “worse” on a single continuum — that’s comparing apples to oranges and oranges to toaster ovens. We started working toward better groupings last fall with our revised approach to the Basic Classification (you can read more about that on our website).
The second goal of our methodology is to determine the levels of access that schools provide to students and the economic success of those learners once they leave. We intend to measure these as separate ideas, recognizing that they are often conflated in other social/economic mobility models. By evaluating access and outcomes separately, we hope to better understand the multidimensional nature of social and economic mobility and categorize institutions in a way that can help inform the broader higher education field on how we can get every student into the world closer to the future they want and worked for. That is at the heart of what this classification is all about: strengthening our collective focus on student access as well as on outcomes.
We also intend to build into our approach some key context around the geographical area each institution is serving. A community college in New York City is very different than a community college in rural West Virginia when we consider the types of students they are serving and the workforce students face once they leave, but often their data are evaluated on the same scales. To make more meaningful comparisons, we plan to adjust for geographical context based on where students are from.
As we have worked with our Technical Review Panel, institutional leaders, and other experts to design this approach, we have had several principles in mind. One was that our approach should be relatively simple – and replicable – and we should use a few key metrics instead of many that are all highly correlated. Additionally, even within groups of similar schools, our goal is not to rank them against each other. We aren’t aiming to recreate some of the (laudable) algorithms that attempt to differentiate schools on a complex array of mobility metrics and then list them in a ranking. Instead, we want to illuminate how institutions are addressing these two fundamental goals and identify communities of similar institutions that can work together to improve. The resulting Carnegie Classification may look something like this.
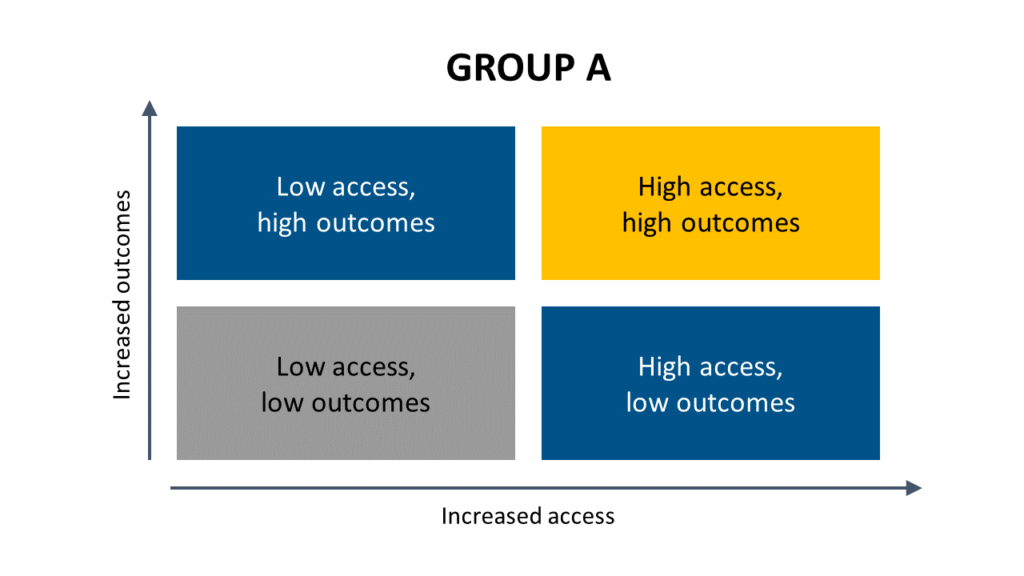
There’s no perfect way to measure social and economic mobility, but the Carnegie Social and Economic Mobility Classification aims to be a more intentional way of measuring how colleges and universities are delivering on their fundamental promise of being socioeconomic engines that empower students to reach their fullest potential. And if we want to hold them accountable to that goal, we have to change the rules of the game so that winning rewards students. For us, that starts with reimagining the Carnegie Classifications.
As we continue to refine our methodology, we welcome any feedback that not only ensures we’re developing a system that truly prioritizes student access and outcomes, but also encourages institutions of higher education to work together to improve for the benefit of their students. Data shows that going onto postsecondary education is still a worthwhile step toward achieving the American dream – and we want to be part of the movement to strengthen that case across every college and university.