In 2022, ACE and the Carnegie Foundation for the Advancement of Teaching partnered to design a Student Access and Earnings Classification that would complement the existing classification structure. The Student Access and Earnings Classification, which has been previously referenced as the Social and Economic Mobility Classification, recognizes student success and drives institutional improvement that can increase access to higher education and improve outcomes.
By design, the Student Access and Earnings Classification identifies the extent to which institutions provide access to students from lower socioeconomic and historically underrepresented racial/ethnic backgrounds along with the degree to which the institution’s students go on to earn competitive wages in the context of their geographic location. The classification also helps users to understand how an institution’s data compares to similar campuses. This classification-based approach will facilitate richer research and study, help to identify successful strategies, and allow institutions to collaborate with each other to find and advance solutions.
The Student Access and Earnings Classification was released in April 2025 alongside the revised Institutional Classification.
Purpose and Overview of the Student Access and Earnings Classification
The Carnegie Classifications staff worked with several experts and advisory groups, including a Technical Review Panel and Institutional Roundtable, to develop a framework for classifying institutions based on the types of students they serve and the economic outcomes that students experience. For more context on these conversations, please read the blog post from the chair of the Technical Review Panel.
The Student Access and Earnings Classification has the following objectives:
- Assess the extent to which institutions offer broad access to learners, particularly those who have been underserved, and evaluate the earnings outcomes of past students.
- Consider the context and location an institution is operating in by examining whether an institution is providing access to a student population that reflects the locations they serve, and after students leave, how much are they making compared to peers in their job market.
- Facilitate comparison within similar institutions by using groupings drawn from the 2025 Institutional Classifications.
- Present the results in a visual way that emphasizes the complex and multidimensional nature of access and outcomes.
The Student Access and Earnings Classification aims to spur collaboration and institutional improvement with a focus on how higher education can foster opportunities for student success.
Data and Methodology
Data used
The Student Access and Earnings Classification is a universal classification that is automatically given to institutions. In order to maximize institutional coverage, the classification relies on publicly available data sources that contain data on all institutions in the United States. These data provide key information about a campus, but they are sometimes limited. This project believes that public, universal data can be used to make meaningful analyses that can complement other sources, including more detailed datasets that cover a smaller number of institutions.
For a full discussion of the Student Access and Earnings Classification methodology, please access the technical manual.
Data sources include:
- Access Measure:
- Pell grant recipient enrollment data are from the IPEDS Student Financial Aid Survey from 2022-23.
- Undergraduate student enrollment data by race/ethnicity are from the IPEDS 12-month Enrollment Survey from 2022-23. In calculating percentages, we did not include students reported with an unknown race/ethnicity.
- Student state of residency data are from the IPEDS Fall Enrollment Survey for 2020 and 2022 (mandatory reporting years). If an institution completed this information for 2021, that data was averaged with the 2020 and 2022 data. In calculating percentages, we did not consider students from non-U.S. locations.
- U.S. Census American Community Survey data on both the percentage of the families with children earning less than 200% of federal poverty guidelines and the racial/ethnic composition of the population 25 and older with a high school diploma or higher at the national, state, core-based statistical area, and non-core-based statistical area level.
- Earnings Measure:
- Earnings data are from the College Scorecard and reflect the median earnings value eight years after entry for all Title IV undergraduate students, including full- and part-time students and including transfer or other non-first time students. Students who were enrolled in school, had died, or who did not report any income data were not included. These data are collected through a partnership of the U.S. Department of Education and the Internal Revenue Service.
- Additional data reported through the IPEDS 12-month Enrollment Survey in 2011-12 and 2012-13 were also included in the earnings formula to incorporate institutions’ student body demographic context during the time that students entered the institution. Specifically, the classifications considered undergraduate student race/ethnicity and migration data.
- Regional institutions were identified by the Alliance for Research on Regional Colleges. Associate and Associate/Baccalaureate Colleges were identified from the 2025 Institutional Classification.
- U.S. Census American Community Survey earnings data by race/ethnicity for the population aged 22-40 with a high school diploma or higher at the national, state, core-based statistical area, and non-core-based statistical area level.
Methodology summary
The classification is based on the calculation of two measures:
- Access: To measure access, the classification evaluates whether institutions are enrolling a student population that is representative of the locations they serve. To do this, we used the enrollment of undergraduate students by Pell grant status and underrepresented race/ethnicity. Those data were contextualized based on the location that students are from using IPEDS migration data.
- Earnings: To measure economic outcomes, the classification compares median post-attendance earnings as reported by the College Scorecard to earnings of people in their area ages 22-40 who hold a high school diploma or higher. Recognizing that student data is variable based on geographic location and race/ethnicity, earnings data was analyzed based on the geographical and racial/ethnic composition of the student body.
Both dimensions operate by examining an institution’s data in relation to a comparison value that describes the socio-economic composition of the geography that each school serves. This geography is customized to each institution and is created with an enrollment-weighted averaging approach that uses student state of residency data. The approach uses the top three states from which students migrate to a school to define this geography. For regional institutions and primarily associate colleges, the institution’s metropolitan or micropolitan statistical area (or, for rural campuses, the rural portion of the state) is used in lieu of the top state.
In this approach, the classification creates ratios, with a value of 1 meaning an institution’s data perfectly aligns with the comparison value describing the geography of that school. Values greater than 1 indicate an institution’s data is higher than the comparison value. Values less than 1 indicate an institution’s data is lower than the comparison value. For example, an earnings ratio of 1.5 would mean that an institution’s median earnings are 50% above the enrollment-weighted average of the median earnings of the comparison group in the geographies that institution serves
Based on their two ratios, institutions generally fall into one of the following categories:
- Opportunity Colleges and Universities (Higher Access, Higher Earnings): Institutions whose access ratio is at least 1 and whose earnings ratio is at least 1.5 (for baccalaureate and higher institutions) or 1.25 (for primarily associate colleges).
- Higher Access, Medium Earnings: Institutions whose access ratio is at least 1 and whose earnings ratio is between 1 and 1.5 (for baccalaureate and higher institutions) and 1 and 1.25 (for primarily associate colleges).
- Higher Access, Lower Earnings: Institutions whose access ratio is at least 1 and whose earnings ratio is less than 1.
- Lower access, Higher Earnings: Institutions whose access ratio is less than 1 and whose earnings ratio is at least 1.5 (for baccalaureate and higher institutions) or 1.25 (for primarily associate colleges).
- Lower Access, Medium Earnings: Institutions whose access ratio is less than 1 and whose earnings ratio is between 1 and 1.5 (for baccalaureate and higher institutions) and 1 and 1.25 (for primarily associate colleges).
- Lower Access, Lower Earnings: Institutions whose access ratio is less than 1 and whose earnings ratio is less than 1.
About 900 institutions are unable to be classified in the Student Access and Earnings Classification for various reasons, including insufficient data for students at that institution or insufficient data for the majority of institutions in the Institutional Classification. Additionally, some Institutional Classifications include colleges with a mix of award levels. In those cases, the threshold for the higher earnings category for all institutions in that classification is set at 1.25 regardless of the award level focus at a particular institution.
For more information, please see the technical manual.
Visualization and Classifications
The Student Access and Earnings Classification separately analyzes the concepts of access and earnings outcomes. The classification visualizes institutions using both of these measures and compares the institution to others that share the same Institutional Classification. This helps to hold constant important institutional characteristics, such as the academic mix and award level focus.

In this approach, users can see how similar types of institutions perform on their access and earnings measures.
To interact with the classifications, please visit the visualization.
Opportunity Colleges and Universities
As noted above, institutions that exceed the thresholds for higher access and higher earnings are designated as Opportunity Colleges and Universities. In the 2025 Carnegie Classifications, 478 institutions received this designation. Those institutions are located throughout the country and span all types of classifications and sectors.
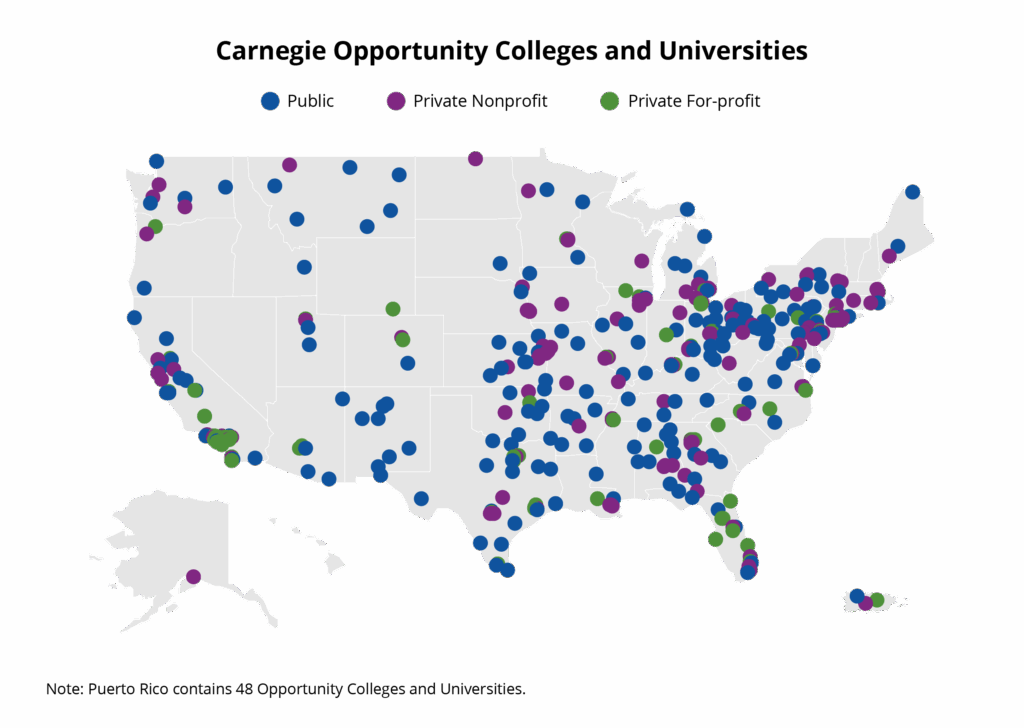
The Student Access and Earnings Classification visualization provides a number of filters through which users can understand the different types of Opportunity Colleges and Universities. More insights and research on this group of institutions will be shared over the coming months.
Student Access and Earnings Classification Links
Student Access and Earnings Classification Visualization
Student Access and Earnings Classification Technical Manual
2025 Student Access and Earnings Public Data File
2025 Opportunity Colleges and Universities By Institutional Classification